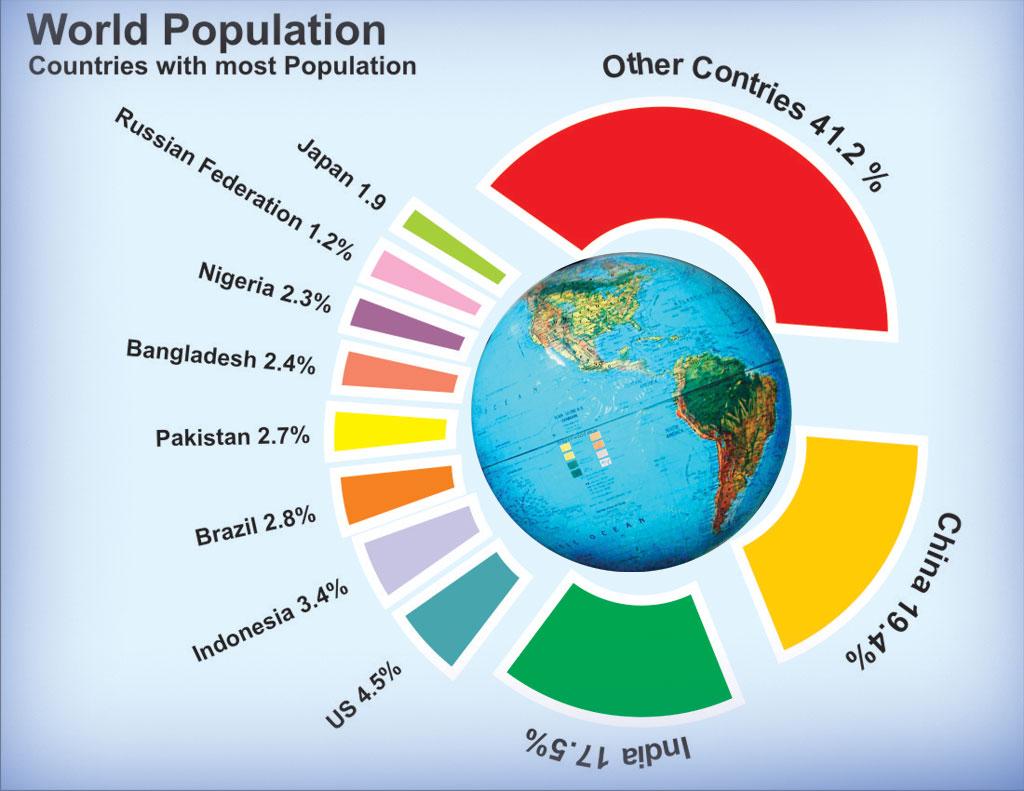
OBJECTIVE: Given a chromebook with access to the internet as well as access to their Google drive acct, students will research data about their selected country and fill-in a data sheet. This data sheet will be used to build an Infographic on a Poster Board
Given a chromebook with access to the internet, student will record information presented in a powerpoint and fill-in a data chart for the various stages of a "Democratic Transition Model"
RATIONALE: Students need to understand the key population components that are present in each country to understand their challenges as it relates to advancing along the Demographic Transition Model sequence from a lower stage country to a more modern stage country.
Students need to understand the various causes/forces which propel a country along the various stages of economic and social development within a Democratic Transition Model process
EVIDENCE: By filling in the chart, students will become demonstrate the ability to locate specific data from a data packet, translate that data into a graph or chart, and then display that data in an Infographic for easier understanding.
By filling in their chart, students will be able to identify how demographers classify countries along the Demographic Transition Model, and will be able to identify where "their country" (the one they selected as part of the Infographic project) is located.
____________________________________________________________________
This short video will be followed by a short TED conference video from Hans Rosling about the Population Growing Box by Box - Population Growth Box by Box
____________________________________________________________________
Students will then be assigned a short article and questions about efforts to limit population growth.
Here is the article - Should we limit population?
Given a chromebook with access to the internet, student will record information presented in a powerpoint and fill-in a data chart for the various stages of a "Democratic Transition Model"
RATIONALE: Students need to understand the key population components that are present in each country to understand their challenges as it relates to advancing along the Demographic Transition Model sequence from a lower stage country to a more modern stage country.
Students need to understand the various causes/forces which propel a country along the various stages of economic and social development within a Democratic Transition Model process
EVIDENCE: By filling in the chart, students will become demonstrate the ability to locate specific data from a data packet, translate that data into a graph or chart, and then display that data in an Infographic for easier understanding.
By filling in their chart, students will be able to identify how demographers classify countries along the Demographic Transition Model, and will be able to identify where "their country" (the one they selected as part of the Infographic project) is located.
____________________________________________________________________
This short video will be followed by a short TED conference video from Hans Rosling about the Population Growing Box by Box - Population Growth Box by Box
____________________________________________________________________
We will cover stages 3 - 5
The next step will be to finish the DTM ppt and finish to fill-in the DTM chart they made last week. After each stage is presented, students should finn-in the appropriate info into the DTM chart.____________________________________________________________________
Students will then be assigned a short article and questions about efforts to limit population growth.
Here is the article - Should we limit population?
Students will be given time in class to continue to work on building their Infographic
____________________________________________________________________
Gates Annual Letter - Gates Letter
Boundless Malthus theory - Malthus
____________________________________________________________________
Boundless Malthus theory - Malthus
